Standard Score Excel

Introduction to Standard Score in Excel

The standard score, also known as the z-score, is a statistical measure that describes how many standard deviations an element is from the mean. In Excel, calculating the standard score can be useful for data analysis and understanding the distribution of data. This blog post will guide you through the process of calculating the standard score in Excel, its applications, and provide tips for effective data analysis.
What is Standard Score?

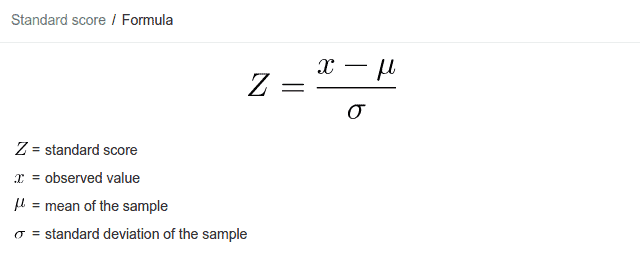
The standard score is calculated using the formula: z = (X - μ) / σ, where z is the standard score, X is the value of the element, μ is the mean of the dataset, and σ is the standard deviation of the dataset. A standard score tells you how many standard deviations away from the mean your value is. A positive standard score indicates that the value is above the mean, while a negative standard score indicates that the value is below the mean.
Calculating Standard Score in Excel

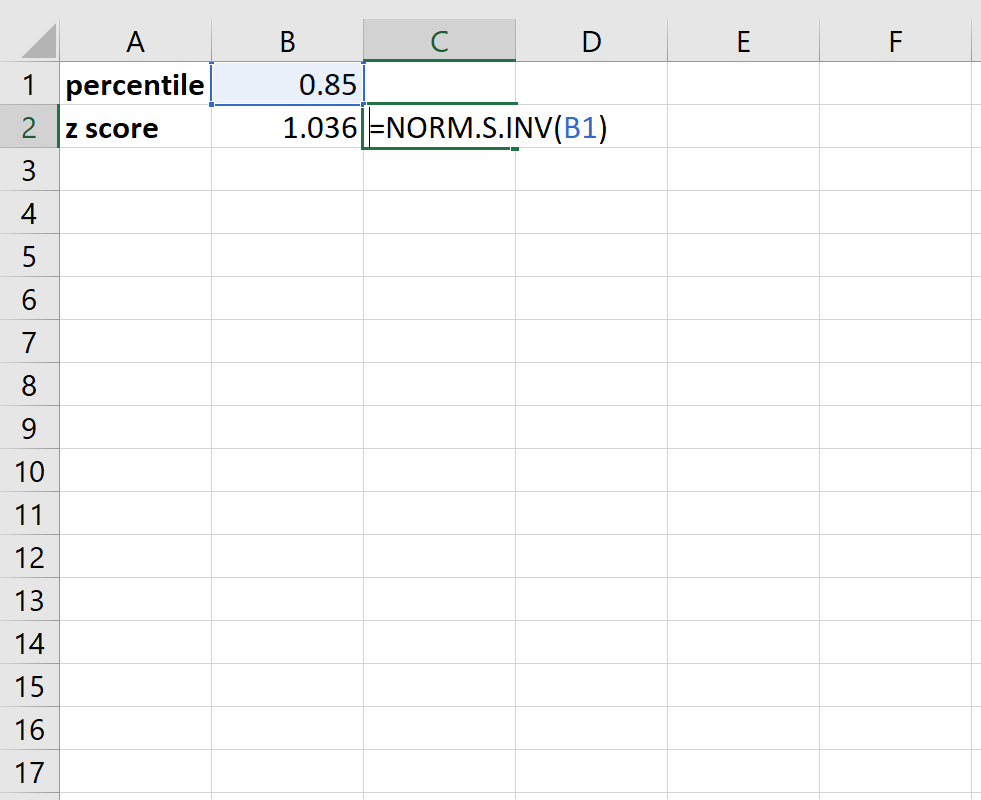
To calculate the standard score in Excel, you can use the following steps: * Calculate the mean (μ) of your dataset using the formula: =AVERAGE(range) * Calculate the standard deviation (σ) of your dataset using the formula: =STDEV(range) * Calculate the standard score (z) using the formula: =(X - μ) / σ
You can also use the =STANDARDIZE function in Excel, which calculates the standard score directly. The syntax for this function is: =STANDARDIZE(X, μ, σ)
Applications of Standard Score

The standard score has several applications in data analysis, including: * Identifying outliers: Data points with a standard score greater than 2 or less than -2 are considered outliers. * Comparing datasets: Standard scores can be used to compare the distribution of different datasets. * Normalizing data: Standard scores can be used to normalize data, which can be useful for certain types of analysis.
Example of Calculating Standard Score in Excel

Suppose we have a dataset of exam scores with a mean of 80 and a standard deviation of 10. We want to calculate the standard score for a student who scored 90.
| Score | Mean | Standard Deviation | Standard Score |
|---|---|---|---|
| 90 | 80 | 10 | =(90-80)/10 = 1 |

In this example, the standard score is 1, which means that the student’s score is 1 standard deviation above the mean.
📝 Note: The standard score is sensitive to outliers, so it's essential to check for outliers before calculating the standard score.
Tips for Effective Data Analysis

Here are some tips for effective data analysis using standard scores: * Use visualization tools: Visualizing your data can help you understand the distribution and identify outliers. * Check for assumptions: Make sure that your data meets the assumptions of normality and equal variance before calculating the standard score. * Use multiple metrics: Use multiple metrics, such as the mean, median, and standard deviation, to get a comprehensive understanding of your data.
| Dataset | Mean | Standard Deviation | Standard Score |
|---|---|---|---|
| Exam Scores | 80 | 10 | =(90-80)/10 = 1 |
In summary, calculating the standard score in Excel is a useful tool for data analysis. By understanding how to calculate the standard score and its applications, you can gain insights into your data and make informed decisions.
The final thoughts on this topic emphasize the importance of understanding the standard score and its applications in data analysis. By following the steps outlined in this blog post, you can calculate the standard score in Excel and use it to inform your data-driven decisions.
What is the formula for calculating the standard score?

+
The formula for calculating the standard score is: z = (X - μ) / σ, where z is the standard score, X is the value of the element, μ is the mean of the dataset, and σ is the standard deviation of the dataset.
How do I calculate the standard score in Excel?

+
You can calculate the standard score in Excel using the formula: =(X - μ) / σ, or by using the =STANDARDIZE function, which calculates the standard score directly.
What are the applications of the standard score?

+
The standard score has several applications, including identifying outliers, comparing datasets, and normalizing data.


